VPM Buffer
Buffer management is the advanced VPM execution mode for projects with meaningful uncertainty and hard delivery expectations.
For full conceptual foundations, including distributed vs consolidated buffer, Student Syndrome, Parkinson's Law, and adoption tradeoffs, see Buffer Methodology.
In this mode, teams do not manage schedule health by asking, "Did every task hit its date?" They manage one shared currency: remaining buffer.
When to Use Buffer Management
Use buffered execution when most of these are true:
- The phase is complex and cross-functional.
- Unknowns are likely to create frequent 1-3 day slips.
- The delivery date matters to customers, launch windows, or executive commitments.
- You need an early warning signal before a milestone is missed.
For simpler efforts, use the unbuffered mode described in VPM Stand-Up Meetings.
Why Consolidate Buffer
When teams hide contingency inside task estimates, two predictable effects appear:
- Start-late behavior: work starts later because "there is still time."
- Finish-late behavior: work expands into the full allotted duration.
VPM counters this by pulling implicit padding out of individual tasks and consolidating that time at phase end as explicit project buffer.
Building the Buffered Plan
- Build the integrated swim-lane schedule first.
- Compress task durations using realistic execution assumptions and risk.
- Collect removed time as explicit phase-end buffer.
- Keep one committed end date and one execution target date.
- Reserve visible buffer space on the project canvas from day one.
Fever Chart: The Primary Scoreboard
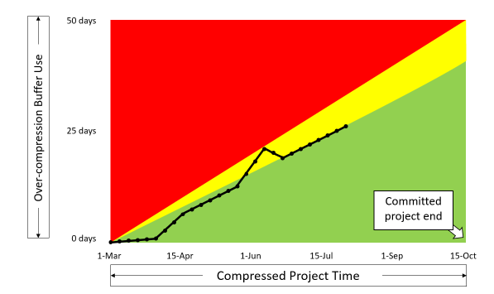
Figure: Fever chart used to track buffer consumption as a leading schedule signal.
The fever chart tracks:
- Horizontal axis: elapsed project time.
- Vertical axis: consumed buffer.
A diagonal reference line represents proportional consumption through time. Staying below that line indicates acceptable burn rate. Crossing above it indicates growing schedule risk.
Typical operating interpretation:
- Green: continue normal execution.
- Yellow: prepare countermeasures immediately.
- Red: Stop-Fix alarm, run a play now.
Buffered Stand-Up Update Sequence
In buffered mode, update the canvas in a fixed sequence:
- Update progress bars on active tasks.
- Move the Done line to the rightmost point allowed by least-progressed critical work.
- If Done trails Today, shift the date strip left until Today aligns with Done.
- Record total consumed buffer on the fever chart.
- Place delay dots on the task or tasks that consumed buffer this cycle.
- If the chart is red, run a play and update the near-term plan.
Visual Agreement Rule
A well-run buffered canvas keeps three views in agreement:
- Latest fever-chart point.
- Total date-strip shift.
- Total delay-dot count.
If these disagree, teams are usually updating status reports after the fact rather than managing execution in real time.
Playbook Response in Red
When the chart enters red, use one or more play types:
- Restructure work: remove unnecessary dependencies, split tasks, parallelize safely.
- Increase effective capacity: add help, rebalance loading, free key contributors.
- Reduce effort: defer features, stage scope, or negotiate a controlled release change.
Red is an action state, not a monitoring state.
Portfolio Snapshot Extension
At portfolio level, leaders can use a snapshot fever chart to view the current risk position of all active projects at once. The purpose is fast prioritization of where intervention is needed now.
See Also
Related: Risk and Buffers — the buffer as the project's risk instrument.