History of VPM
Introduction
If you are looking for measured outcome proof first, see Proof VPM Works. This chapter focuses on where the method came from and why its mechanics differ.
VPM did not emerge from a single source. It draws on multiple traditions that each tried to solve the same problem — projects managed with Gantt charts were failing at alarming rates. Three streams converged: (1) Critical Chain Project Management brought buffer management and the fever chart, (2) industrial companies independently developed wall-based visual planning to escape Gantt complexity, and (3) VPM synthesized and extended both with original innovations. This chapter traces those streams.
Gantt Charts
Gantt charts have long been the go-to tool for visualizing project schedules, tracing their roots back to the early 1900s. They present a timeline view of tasks, clearly showing start and end dates, durations, and dependencies in a horizontal bar format. Gantt charts brought structure and predictability to project planning, and their popularity has been reinforced by the widespread support in tools like Microsoft Project, Smartsheet, and dozens of other project management platforms. This deep integration across enterprise tools has made Gantt charts a default standard—easy to adopt, easy to share, and deeply embedded in how organizations think about schedules.
But despite their strengths, Gantt charts often contribute to late projects. One key issue is that they treat all tasks equally, with each assigned a single line regardless of its complexity or criticality. A minor administrative task receives the same visual weight as a major cross-functional handoff. This flattens the view and dilutes attention from the workflows that truly drive progress. Moreover, the sheer number of tasks—often in the hundreds—creates a dense web of interconnections that spans many pages, making it hard to see what matters most. As a result, teams lose sight of the critical path and struggle to coordinate major transitions. Plan changes are painful to implement, and the complexity makes forecasting unreliable, which contributes to chronic on-time-delivery underperformance (for a current measured case, see Proof VPM Works).
In Visual Project Management (VPM), we build directly on the legacy of the Gantt chart by keeping its greatest strength: a calendared, visual representation of project timing. We retain the clarity of seeing when things happen and how they align across time—but we eliminate the clutter. Rather than trying to map every small task, VPM focuses on a streamlined view that shows only the most critical elements of the project. These include major deliverables and key handoffs between functions, which are displayed visually to help the team track progress and risk in real time. The timeline remains central, but it is cleaner, more readable, and far more actionable.
Rather than listing hundreds of tasks, VPM forces the team to concentrate on the most important ones—those that generate tangible deliverables and those that represent handoffs between functions. We distinguish between in-function tasks, which stay within a department, and cross-functional tasks, where the work moves between groups like engineering, operations, and marketing. Our emphasis will be on these cross-functional transitions, as they often create the greatest risk and delay. This sharper lens makes the critical path more visible and actionable.
Gantt Dependencies: Brittle Dependency Networks Where a Flexible RACI Architecture Is More Effective
The Problem With Gantt Dependencies
If you've managed a development project with a Gantt chart, you know the pattern: You spend weeks building a detailed project plan with hundreds of task dependencies. Within three months, it's out of date. Requirements change, technical challenges emerge, resources shift—and your carefully crafted dependency network becomes so fragile that updating it is more work than abandoning it.
Observed pattern: In many development organizations, traditional Gantt plans become obsolete quickly as requirements, interfaces, and sequencing change. The issue is structural: dependency webs are expensive to maintain under real product-development volatility.
This isn't a user problem—it's a tool problem.
Gantt charts were designed in the 1950s for construction: fixed scope, sequential work, minimal iteration. Development projects are the opposite: requirements evolve, teams work in parallel, learning is continuous. The tool doesn't match the work.
The fundamental flaw: Gantt dependencies treat all relationships the same. "QA reviews Engineering's draft specification" gets the same dependency arrow as "Engineering delivers firmware to Operations for testing." One is internal coordination. The other is a critical cross-team handoff. Gantt can't tell the difference, so you end up with 200+ dependencies when the project really has 12-15 critical interfaces.
When requirements change (and they will), you face an impossible choice: spend hours rewiring the dependency web, or let the chart go stale. Most teams choose the latter.
How VPM Changes This: Summary Task Dependencies
VPM takes a fundamentally different approach based on a simple question: When does the "Accountable" role shift between teams?
This comes from the RACI model (Responsible, Accountable, Consulted, Informed):
- Accountable (A): The team that owns the deliverable and must sign off
- Responsible (R): Teams that do work or provide input
VPM focuses exclusively on when "A" shifts from one team to another. These are true handoffs—the moments where one team commits a deliverable and another team takes accountability for the next phase.
Example: Firmware Development
Traditional Gantt shows:
- Task 47: QA reviews firmware spec → Engineering (dependency)
- Task 48: Manufacturing reviews firmware spec → Engineering (dependency)
- Task 49: Operations reviews firmware spec → Engineering (dependency)
- Task 50: Engineering incorporates feedback → QA review (dependency)
- Task 51: Engineering incorporates feedback → Manufacturing review (dependency)
- Task 52: Run initial firmware tests → Operations (dependency)
- Task 53: Operations validates test environment → Engineering (dependency)
Result: 7+ dependencies representing coordination and back-and-forth reviews.
VPM shows:
Summary Task: "Firmware Test Build Ready"
  Accountable: Engineering
  Successor: "Operations Testing Phase"
  Accountable: Operations
Result: 1 clean handoff representing the commitment.
What happened to tasks 47-53? They still exist as subtasks under "Firmware Test Build Ready" for the Engineering team to manage. But VPM doesn't visualize them because they represent the Engineering team coordinating with others (RACI: "R" roles) while Engineering remains Accountable.
The key insight: There may be 20 internal coordination points to get a firmware build ready, but VPM visualizes only the handoff—the moment Engineering commits the build and Operations becomes Accountable for testing it. We trust teams to manage their internal coordination if we keep them focused on their cross-team commitments.
Why VPM Doesn't Import Dependencies
When you import from MS Project or a Gantt chart, VPM imports:
- Task names and structure
- Dates (as reference points)
- Function assignments
- Dependencies (you'll redesign these)
Why strip the dependencies?
Because Gantt dependencies mix true handoffs with internal coordination and create structures too fragile to maintain. VPM asks you to redesign your project around 12-15 clean deliverable interfaces between teams, not 200+ task-level dependencies.
The investment: 2-4 hours using VPM's import wizard to identify your critical cross-team handoffs.
The payoff: When requirements change (and they will), you update deliverable dates on Summary Tasks, not rewire a web of 200 dependencies. Your project plan stays current instead of becoming obsolete.
Two Tools, Two Purposes
VPM doesn't replace your detailed Gantt chart—it complements it:
Gantt (MS Project): Detailed task scheduling, critical path analysis, resource leveling, day-to-day execution
- Users: Project team, task owners
- Update frequency: Daily/weekly
- Focus: "What's the next task?"
VPM: Cross-functional commitments, interface management, executive visibility
- Users: Leadership, cross-functional teams, stakeholders
- Update frequency: Weekly/monthly
- Focus: "When does each team deliver to other teams?"
The Bottom Line
Development projects need flexibility to respond to change. Gantt's 200+ dependencies create rigidity. VPM's 12-15 interface commitments create clarity while allowing teams autonomy to manage their internal work.
We don't import Gantt dependencies because they're part of the problem we're solving.
When you import your project into VPM, you're not migrating a mess—you're redesigning your project around clean handoffs. It's more work upfront, but it's the only project plan that will still be accurate three months from now.
Critical Path Management
To improve focus within Gantt charts, project managers often augment them with a Critical Path analysis—a powerful enhancement that highlights the sequence of tasks that directly determine the project's duration. By identifying which tasks cannot slip without delaying the entire project, Critical Path Management (CPM) brings clarity to complex plans and helps teams prioritize effort and attention. This advancement was so impactful that it became a discipline in its own right, with CPM now a cornerstone of traditional project management. By pulling the critical tasks to the foreground, teams can track the real drivers of schedule performance and manage risk more proactively.
Still, CPM doesn't fully resolve the underlying challenges. First, finding the critical path among hundreds of interdependent tasks is complex, and often the path identified early is just a best guess—it shifts as the project unfolds. Unfortunately, these shifts often become visible only after delays start to accumulate. Adapting to changing critical paths mid-project requires substantial rework, and with large Gantt charts, that means navigating a maze of dependencies. The second issue is unpredictability: even a well-crafted plan can be upended by unexpected events—like a supplier delay due to a factory accident. These kinds of disruptions can't be forecasted and demand agile responses. But Gantt-based systems, with their dense networks and rigid structures, are inherently slow to adapt. This mismatch between complexity and agility limits the effectiveness of both Gantt and CPM in dynamic, fast-moving projects.
In Visual Project Management (VPM), we embrace the value of Critical Path thinking and build directly on the foundation laid by Gantt and CPM. But we sharpen its effectiveness by recognizing that critical paths are not fixed — and that no amount of upfront analysis can make them fixed. As Helmuth von Moltke observed, "No plan survives first contact unchanged." In new product development, the team is by definition doing something for the first time. The project will go directions no one can predict with accuracy, no matter how detailed the plan.
VPM responds to this reality not by adding more analytical rigor, but by building a method that combines a strong plan entering execution with the agility to react to changes as they present themselves. The team agrees on what the critical path is today, identifies candidate paths that could become critical if circumstances shift, and prepares to pivot when — not if — the situation changes. This is not a mathematical construct. There are no probability percentages or criticality indices. It is team consensus, reassessed regularly, creating a group of problem solvers ready to respond when reality diverges from the plan. The alternative — seeking the all-knowing PM who plans every detail correctly and completely, down to predicting which path will shift six months out — is a unicorn. Methods built on ever-increasing detail are impractical for the dynamics of new product development. VPM retains the strengths of Gantt and CPM while replacing their brittle precision with prepared adaptability.
Critical Chain Project Management
Critical Chain Project Management (CCPM), developed by Eliyahu Goldratt, represents a major evolution in traditional planning methods. CCPM builds on critical path principles by sharpening the focus on essential tasks and protecting the project timeline with time buffers—both at the end of the chain and at key junctions between task sequences. These buffers absorb variability and make schedules more resilient to disruption. A major innovation is the fever chart, a visual tool that tracks buffer consumption over time and helps teams recognize when a project is slipping before it's too late. CCPM also introduces the concept of reflection—quantifying every issue by its impact on time. For example, if a design flaw will delay quality testing by six weeks, that delay becomes the unit of analysis. Since time is the bottleneck in most projects, CCPM treats it as the common denominator for all risk and decisions, aligning everyone around schedule impact.
CCPM has produced strong results in many organizations. Reported examples include major schedule compression and on-time-delivery gains in product and capital programs (for example: Lucent, Harris, FMC, and Boeing T-45 programs as cited in practitioner literature). These are important results and should be treated seriously.
VPM is directly derived from CCPM and keeps many of its best ideas, especially clear ownership, sharp focus on the currently constraining path, and deliberate use of buffer to counter behaviors such as Student Syndrome and Parkinson's Law (see Buffer Methodology).
Why CCPM Often Struggled to Become the Default
A fair reading of both practitioner and research literature is that CCPM delivered real wins, but sustained enterprise deployment was often harder than early success stories suggested:
- Method complexity: peer-reviewed analyses repeatedly note complexity in real implementation, especially in multiproject environments and resource coordination (Lechler et al., 2005).
- Buffer mechanics debate: critical studies report ongoing controversy around strengths and pitfalls, including sensitivity in buffer sizing assumptions such as the 50% rule (Herroelen et al., 2002; Herroelen & Leus, 2001).
- Adoption burden: reviews conclude CCPM has valuable concepts but is not a complete replacement for broader project-management practice and carries non-trivial adoption cost (Raz et al., 2003).
- Evidence pattern: modern reviews still find active research, but much of it is modeling/simulation rather than broad field validation, with explicit gaps in empirical deployment contexts (Ghaffari & Emsley, 2015; de Oliveira Martins et al., 2025).
Inference from these sources: CCPM did not "disappear." It evolved into a specialist method with strong pockets of success, while many teams adopted selected ideas (buffer thinking, focus rules, anti-multitasking discipline) without full-method deployment.
For an academic study design and testable hypotheses on this CCPM-to-VPM evolution path, see Academic Research Proposition.
Despite its strengths, CCPM has limitations. It still assumes a single dominant critical chain, which can oversimplify the reality of complex, uncertain projects where multiple paths have the potential to drive the timeline. More importantly, because CCPM organizes its entire structure — buffers, feeding chains, resource assignments — around the critical chain as understood at project start, a shift in the critical path becomes a major event. The project must be substantially re-laid-out, buffer positions recalculated, and history organized around the old chain often loses its relevance. The result is chaotic changes in tack rather than orderly adjustment. In VPM, by contrast, the team adjusts the critical path continuously — often multiple times in a week, typically by a few days at a time — so the project smoothly adapts to change the way a sailor trims the sails rather than coming about in heavy seas.
The model also tends to focus on resource-level task assignments rather than visualizing clear ownership across functions, which makes coordination difficult — especially in cross-functional handoffs that often introduce the greatest risk. These transitions are not treated as special or high-priority in CCPM, limiting visibility into workflow alignment. Furthermore, the structured and analytical nature of CCPM can feel rigid. The formalism and terminology — buffers, chains, fever charts — create a steep learning curve that can alienate teams unfamiliar with the Theory of Constraints. And when the plan feels fixed, teams may hesitate to step back, rethink the structure, or act with agility. These gaps open the door for a new approach — one that keeps the strengths of CCPM but reorients project visibility, flexibility, and ownership for modern teams.
CCPM's Contribution to VPM
CCPM, developed by Eliyahu Goldratt and published in his 1997 book Critical Chain, made several contributions that VPM builds on directly.
The fever chart concept. CCPM introduced the idea of a single visual indicator that shows project health at a glance — plotting buffer consumption against project completion. This was a breakthrough in making project status visible and actionable without requiring anyone to read a detailed status report. VPM adopts the fever chart as a core tool, but with a significant modification (see "What VPM Adds" below).
Reflection — measuring everything in time. CCPM introduced the discipline of quantifying every issue by its impact on the schedule. If a supplier delay will push testing back by six weeks, that six weeks becomes the unit of analysis. Since time is the bottleneck in most development projects, CCPM treats it as the common denominator for all risk and decisions. VPM carries this principle forward.
Buffer management over task tracking. CCPM shifted attention from "Did task X finish on time?" to "How much schedule protection remains?" This reframing reduced micromanagement and focused leadership attention on overall project health rather than individual task compliance.
However, CCPM also had limitations that created an opening for a different approach:
- Goldratt's buffer sizing uses a mathematical formula — the "cut and paste" method takes 50% of the estimated duration and places it as a buffer. This requires specialist software and can feel opaque to teams.
- The formalism and terminology create a learning curve that can alienate teams unfamiliar with the Theory of Constraints.
- CCPM still assumes a single dominant critical chain, which oversimplifies complex projects where multiple paths compete to drive the timeline.
- CCPM focuses on resource-level task assignments rather than visualizing clear ownership across functions, limiting visibility into the cross-functional handoffs that often introduce the greatest risk.
Agile
Agile project management emerged from the world of software development as a response to the rigidity of traditional methods like CPM and CCPM. It emphasizes collaboration, fast feedback, and iterative progress. Agile teams plan in short bursts—called sprints—and hold daily stand-up meetings to assess progress and adjust course. A core goal is to get working product into users' hands as quickly as possible so feedback can shape development early, before big investments are made. Agile also encourages parallel thinking by reducing the hard dependencies that define critical path-based approaches. In fact, Agile often refers to CPM-style planning as waterfall—a term that's become pejorative, suggesting inflexible, overly linear workflows that fail to adapt. In contrast, Agile champions flexibility and empowers teams to self-organize and adjust continuously.
But this strength in agility can also become a weakness—especially in complex, cross-functional projects. Agile methods often deprioritize the calendar, making it hard to predict when intermediate milestones will be met. When work runs long, it's simply pushed to the next sprint, which may be fine within a software team but creates serious issues when another function is waiting. For example, if firmware needed for compliance testing isn't complete, hardware development stalls. This looseness in connecting tasks to calendar days makes it difficult to synchronize across departments. Hand-offs become unpredictable, and integrated planning breaks down. VPM addresses this gap by recognizing that software teams will naturally operate using Agile Scrum for their own planning and execution—but cross-functional coordination happens in a different language. VPM provides that language. It centers on handoff timing—ensuring that when one function needs output from another, the date is visible, tracked, and honored. So while software teams may speak "Agile" inside the sprint, the broader project speaks "VPM"—the language of inter-functional synchronization.
Industrial Visual Planning: Walking the Walls
Independent of CCPM, industrial companies began developing simplified visual project management approaches — often called "Walk the Walls" or "Walking the Wall" — as a practical reaction to Gantt chart failure in complex product development.
The practice involves covering a physical wall (or multiple walls) with task cards, sticky notes, or visual indicators organized across a timeline and grouped by functional workstream. Teams then literally walk the wall together during stand-up meetings to review status, identify issues, and coordinate handoffs.
The concept of swim lanes — horizontal bands grouping work by actor — has deep roots. Multi-column process charts appeared as early as 1945 in a US Bureau of the Budget bulletin. An East German standard formalized them in 1968. Geary Rummler and Alan Brache popularized the term "swim lane" in their 1990 book Improving Performance. But these were all process flow diagrams, not project schedules on a calendar. The leap to using swim lanes as a project scheduling tool against a timeline was a separate, later development that appears to have emerged from industrial practice in multiple places.
The Danaher Business System (DBS) adopted visual project management as one of its core execution tools. DBS was modeled on the Toyota Production System beginning in the 1980s and emphasizes visual management, daily stand-ups, and simple physical tools (whiteboards, sticky notes, large paper) over software-based project tracking. The author first encountered VPM through Danaher.
Walk the Walls practices have appeared independently at companies with no apparent connection to Danaher or to each other. The pattern is consistent: teams frustrated with Gantt chart complexity and obsolescence gravitate toward wall-based visual planning that makes status immediately visible and creates a shared physical space for coordination.
The emphasis on physical, low-tech visualization is not accidental. Paper-based walls force simplification — you can only fit so many sticky notes on a wall, which naturally drives teams to focus on what matters most. They also create a gathering point for the team, supporting the daily stand-up rhythm and making status a shared experience rather than a report to be read.
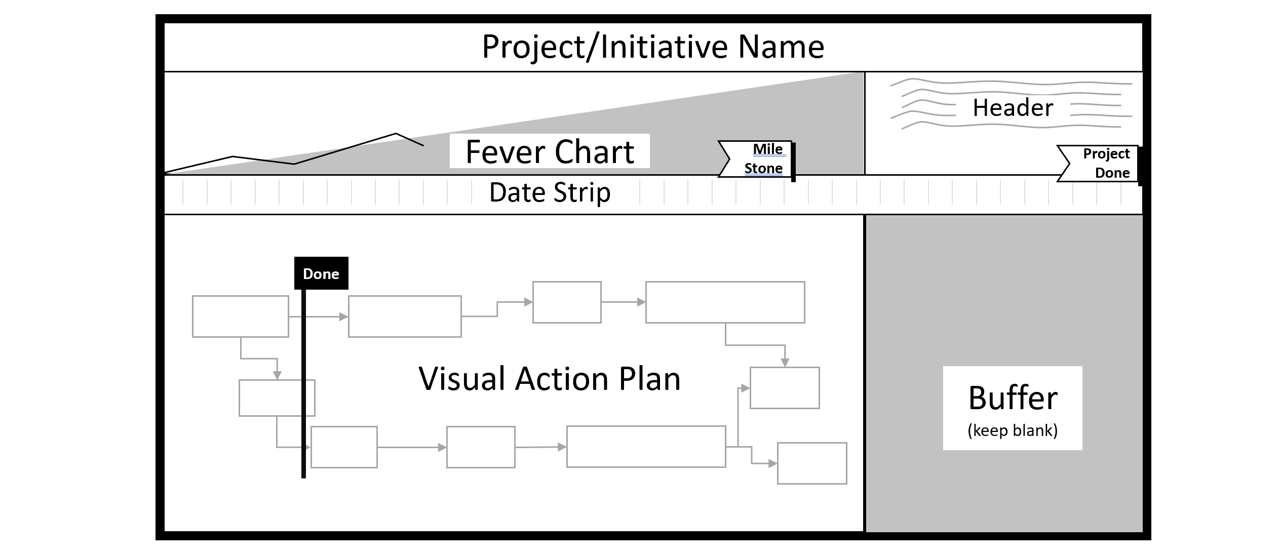
Swim Lane Visualization
One of the key innovations in Visual Project Management (VPM) is the use of swim lanes—horizontal bands that group all tasks from a single function into one continuous row stretching across the calendar. Unlike traditional Gantt charts, where tasks are listed line by line regardless of role, swim lanes organize work visually by function, making cross-functional coordination far more intuitive. Each swim lane focuses on the tasks that matter most for coordination: handoffs and key deliverables. For complex functions like engineering or software development, it's understood that detailed, intra-functional planning still occurs—using Gantt charts, Agile Scrum boards, or other discipline-specific methods. But within the VPM, only the tasks that interact with other teams are shown. This ensures clarity, accountability, and visibility for cross-functional flow without getting lost in the weeds of daily team execution.
Visually, VPM swim lanes resemble Gantt charts in that they use a calendar across the top and represent task durations with horizontal bars. But the similarities end there. While Gantt charts allocate a full line to every task—resulting in plans filled with white space and complex dependency arrows—VPM condenses all of a function's work into a single lane. That lane may contain 50 to 70 tasks in a long project, and yet still occupy the vertical space of just a few Gantt lines. This dramatically increases the visual density of the chart—often 5 to 10 times more information per page. As a result, large portions of a project—or even an entire program—can be viewed at once. This bird's-eye view doesn't just reduce clutter; it fuels insight. When more of the project is visible, it becomes easier to spot misalignments, gaps, and structural issues early, while there's still time to act. Swim lanes make complex work simpler to see, and that clarity creates a powerful foundation for better decision-making.
What VPM Adds: Synthesis and Original Innovations
VPM as described in this wiki synthesizes the best elements of CCPM and industrial visual planning while adding several original innovations.
Consensus-based fever chart. Where Goldratt's fever chart derives from mathematical buffer calculations, VPM builds its fever chart from structured team consensus. The team collectively assesses project health, which serves dual purposes: it produces a meaningful status indicator AND it forces the conversation that surfaces hidden risks. The fever chart becomes a team scoreboard, not a mathematical output.
Structured simplification through handoff focus. VPM shows only the tasks that produce major deliverables or that represent handoffs between functions. In-lane work — the dozens or hundreds of tasks a function manages internally — is deliberately left to the team to manage with whatever method suits their discipline (Agile Scrum, Gantt, action plans, or any other approach). This is a RACI-based architecture: VPM visualizes only the moments when the "Accountable" role shifts from one team to another. The result is typically 40–200 Accountable-level tasks rather than the 500–1,500 found in a traditional Gantt chart.
The human architecture of commitment. VPM integrates team dynamics into the process design, not as a "soft skills" add-on. Drawing on Patrick Lencioni's insight that people will do more not to let their teammates down than not to let their boss down, VPM uses the collaborative planning event to build genuine commitment and peer accountability. Daily stand-ups in front of the shared visual scoreboard reinforce this accountability. When things go sideways — and they will — the team's commitment to each other is what drives rapid response.
Hybrid method synchronization. VPM does not require teams to abandon their existing internal methods. Software teams can run Agile Scrum sprints. Hardware teams can use detailed Gantt charts. The VPM layer provides the cross-functional language that synchronizes them all through shared handoff timing.
Non-deterministic critical path. VPM moves beyond single-critical-path thinking. In real projects, multiple workflows often compete to drive the schedule. The team agrees on the current critical path and identifies candidate paths that could become critical if circumstances change. This is not probabilistic analysis — it is team consensus, reassessed regularly as the project reveals what no plan could have predicted. When a shift happens, the team is already prepared to pivot because they have been watching the candidates all along.
Lean Roots: From Manufacturing Controls to Knowledge Work
VPM is explicitly rooted in Lean thinking, but this chapter only summarizes that lineage.
The full Lean Roots treatment now lives in Lean Thinking, including:
- historical evolution from Toyota to knowledge-work domains,
- inertia-to-change as a Lean adoption constraint,
- and the translation model VPM uses to adapt Lean controls to project environments.
For execution mechanics, see Theory of Operation, especially the "Why the Model Works" section.