Swim Lane Diagram
If you are evaluating outcomes, start with Proof VPM Works.
This page explains the visual execution structure that supports those outcomes.
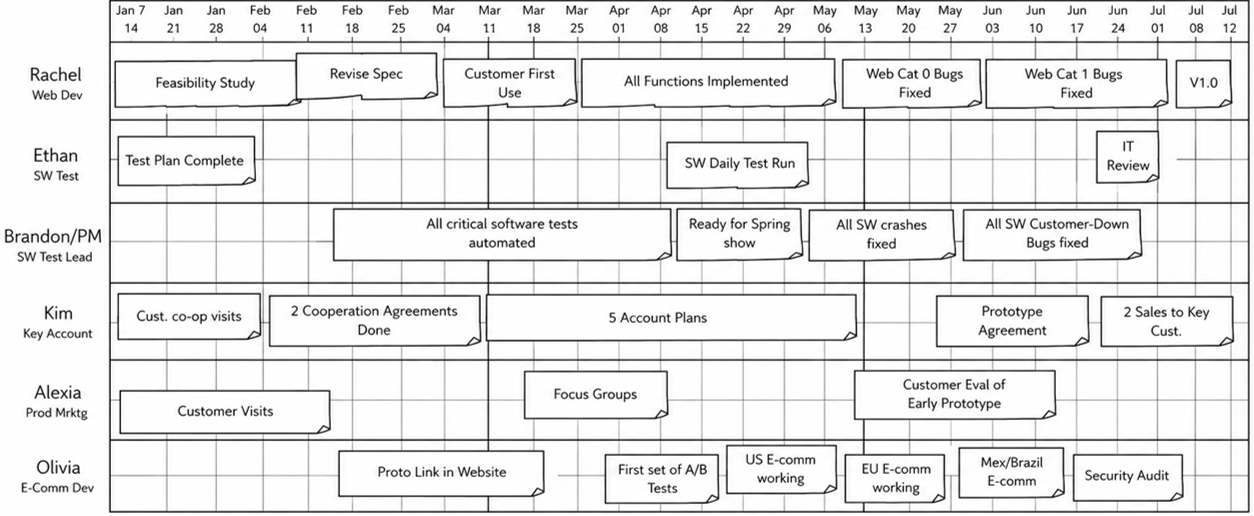
The swim lane view is one of VPM's strongest differentiators. Most tools show tasks or dates in isolation. VPM makes cross-functional flow visible: handoffs, timing stress, and ownership clarity.
At a Glance: Why This View Matters
| What you see | Why it matters |
|---|---|
| Shared calendar | Teams align to one time reference |
| Lane ownership | Accountability is obvious |
| Handoff flow across lanes | Cross-team risk is visible early |
| Today vs Progress gap | Schedule stress appears before missed gates |
Forest and Trees: Gantt vs Swim Lanes
Gantt is best for detailed task execution (trees).
Swim lanes are best for cross-functional flow and handoff risk (forest).
- Swim lane view: manage cross-functional flow and handoff risk.
- Gantt/detail view: manage in-function task execution.
For the architecture behind this split, see RACI Task Breakdown.
Layout
Think of the layout as four coordinated layers:
- Calendar (top): one time axis for all lanes.
- Lane headers (left): ownership and function context.
- Lane schedules (right): tasks, milestones, handoffs over time.
- Health interpretation: how far execution has progressed relative to today.
Calendar
- One column per date.
- Shared across all lanes.
- Useful markers (for example milestones, deadlines, or risk events) should be easy to scan.
Lane Headers
- Include lane name, owner, function, and optional references.
- Keep lane height controlled so one lane does not dominate the screen.
- When a lane is dense, prefer internal scrolling and consolidation over page expansion.
Lane Schedules
- This is where flow is read.
- Tasks and milestones align to the shared calendar.
- Handoffs and critical flow cues should be visible without searching.
Lane Structure and Ordering
Lane order is not cosmetic. It controls what people notice first.
Rule 1: Gate lane is always on top
The top lane is reserved for gates and major project milestones only.
- Allowed: gate events and project-level milestones.
- Not allowed: tasks or deliverables.
This lane is the project rhythm and shared scoreboard.
Rule 2: Functional lanes follow in deliberate order
Recommended order:
- Customer lane (if applicable) to keep customer timing visible.
- Project Manager lane for integration and coordination checkpoints.
- Functional lanes (engineering, software, manufacturing, testing, etc.), ordered by coordination intensity.
This keeps the highest coordination leverage near the top of the working area.
Gates Own Phases, Not Lanes
Most important structural rule:
A gate owns all tasks in its phase across every lane.
A phase is the time span between consecutive gates (or between project start and Gate 1). Any task in that span belongs to that gate's phase, regardless of lane.
Example for Gate 2 ("Design Freeze" on April 15):
- Mechanical task Mar 1 to Apr 10 -> Gate 2 phase.
- Electrical review Apr 12 -> Gate 2 phase.
- Software architecture task Mar 15 to Apr 14 -> Gate 2 phase.
All are children of Gate 2 even though they are in different lanes.
Gates mark completion, not start
- Gate 0: project start (no work complete yet).
- Gate 1: end of phase 1.
- Gate 2: end of phase 2.
- Final gate: project complete.
Tasks should complete before the gate date. The remaining time is schedule protection (buffer).
Tasks Stay in Their Lane
While gates own phase-level work across lanes, tasks own deliverables only inside their own lane.
- A task belongs to one function lane.
- Its deliverables stay in that same lane.
- Cross-lane coordination is handled by handoffs, not by cross-lane deliverable ownership.
Task Hierarchy Summary
| Level | Type | Lives in | Parent | Owns across lanes? |
|---|---|---|---|---|
| L1 | Gate | Gate lane | None | Yes (all L2 tasks in phase) |
| L2 | Task | Functional lane | Gate in same phase | No |
| L2 | Milestone | Functional lane | Gate in same phase | No |
| L3 | Deliverable | Same lane as parent task | Task | No |
Quick lane-content check
Gate lane
- Yes: gates, project-level milestones
- No: tasks, deliverables
Functional lanes
- Yes: tasks, functional milestones, deliverables
- No: gates
Today vs Progress
VPM uses two indicators:
- Today: current calendar date.
- Project Progress: execution position based on least-complete active task.
If a 10-day active task is 50% complete, progress position is task start + 5 days.
The gap between Today and Progress is an early warning signal. A widening gap indicates schedule stress and potential buffer burn.
Operational expectation in daily management:
- Since last meeting, progress should advance by roughly elapsed calendar days.
- If not, trigger focused corrective action instead of passive monitoring.
Arranging Tasks to Reveal Flow
VPM intentionally uses vertical placement to communicate workflow shape, not just task existence.
Pattern examples
| Pattern | Visual cue | Interpretation |
|---|---|---|
| Linear sequence | Same-height horizontal run | Tight handoff chain |
| Cross-lane relay | Alternating bars between two lanes | Repeated interface risk |
| Dense local cluster | Many stacked tasks in one lane | Internal complexity; verify external handoff clarity |
Design goal: a team member should understand "how work moves" without waiting for PM narration.
Choosing Task Granularity
Granularity controls readability and response speed.
- Too small (for example 1-day average): visual clutter, weak flow comprehension.
- Too large (for example 4 to 8 weeks): hidden sub-work, delayed risk detection.
Recommended daily-management range:
- 3 to 10 days for most active tasks.
- Use exceptions intentionally (long lead-time or passive waits).
Coaching prompts when granularity is off
- "Can these one-day items be grouped into a meaningful handoff chunk?"
- "Is this multi-week block hiding intermediate deliverables?"
- "Are there earlier cross-team checkpoints we should expose?"
Swim Lane Tasks as Status Cards
Each task should communicate more than dates.
Minimum status signal set:
- Task name, start, end.
- Lane ownership (Accountable function).
- Key predecessor/successor context.
- Current state (not started, on track, at risk, complete).
- Critical-path or buffer-impact markers where relevant.
Dependency hygiene guideline:
- Emphasize cross-lane dependencies.
- Avoid overloading the view with low-value intra-lane links that hide real interface risk.