Buffer Methodology
Buffer methodology is one of the core differentiators in VPM Works. It is how teams convert uncertainty from a hidden source of delay into a visible, manageable operating signal.
If you are validating outcomes first, see Proof VPM Works. This page focuses on the execution logic behind buffer behavior.
In unbuffered execution, teams react when schedule dates are already late. In buffered execution, teams react earlier by monitoring buffer consumption as a leading indicator. The value is operational: earlier visibility, earlier decisions, and earlier recovery while options still exist.
Related: Project Scoreboard Beats a Newscast — the fever chart is the team's scoreboard; buffer is what makes the game winnable.
Why Buffer Exists in VPM
Unbuffered execution is effective for modest-complexity projects and for teams that are new to VPM. But as uncertainty increases, unbuffered projects can generate frequent Stop-Fix alarms for small slips. That creates noise and operational churn.
Buffer smooths that behavior. Small schedule disturbances can be absorbed without losing control, while meaningful degradation still triggers rapid intervention.
Buffer does not eliminate the need for discipline. It provides insights so the the team can better predict explicit mitigation must be applied and at what scale.
The Core Concept: Buffer as Shared Currency
In buffered execution, teams manage schedule health by managing one shared currency: remaining buffer.
This implies two operating dates:
- The date of current progress, defined by progress of the least-done task.
- The current buffered date, known as "Today."
These two dates must be kept coincident, first by moving least-done tasks forward so long as the critical path is not extended, and second by burning buffer to move Today to the right.
To do this, the team must collect buffer that was likely, often subconsciously, embedded in individual tasks and place it at the end of the phase as consolidated buffer. The team should understand this time is not being taken away; it is being placed in a type of savings account that can be withdrawn as needed. In this way, teams spend buffer wisely instead of wasting it when it is not needed.
Distributed Buffer vs Consolidated Buffer
Most teams distribute buffer unintentionally because experienced people understand execution reality. A contributor may know a task could be completed in 2 weeks under ideal conditions but is more likely to take 3 weeks in real project conditions, so the estimate becomes 3 weeks: roughly 2 weeks of expected execution plus 1 week of protective buffer. There is nothing wrong with this judgment. In fact, a project planned with effectively no buffer (often called a "bone-on-bone" schedule) is unlikely to finish on time. The VPM goal is not to remove the team's ability to use buffer. The goal is to amplify that good practice by collecting and actively managing the buffer that knowledgeable team members already add.
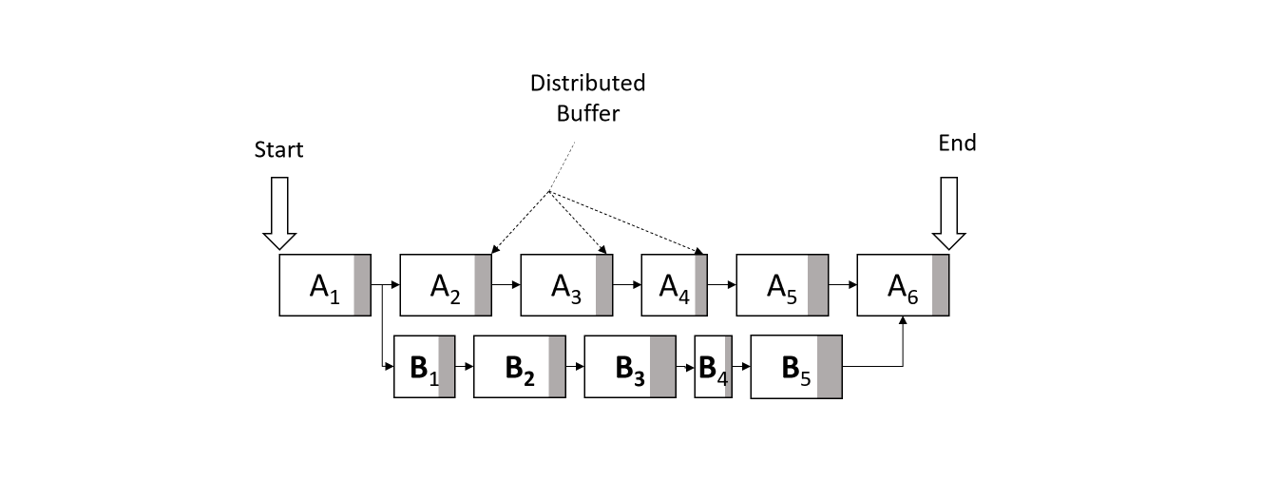
Figure: Distributed buffer spread across many tasks.
VPM consolidates that hidden task-level margin at the end of the project or phase instead. So how much should the buffer be? It is difficult to know exactly, and it likely varies by person and project type. In VPM Works, we use a normal planning value of 25%. In practice, the difference between 20%, 25%, and even 30% usually drives very similar behavior. Teams with more buffer tend to spend more time deciding how to use it.
Over years of using this method, 25% has worked well in most execution-oriented projects. The main exceptions are highly variable efforts such as open-ended technology research, where one can reasonably question whether an execution-style project model is the right fit at all. For projects with meaningful completion dates, 25% has performed well across a wide range of software and hardware efforts, including both new products and new services.
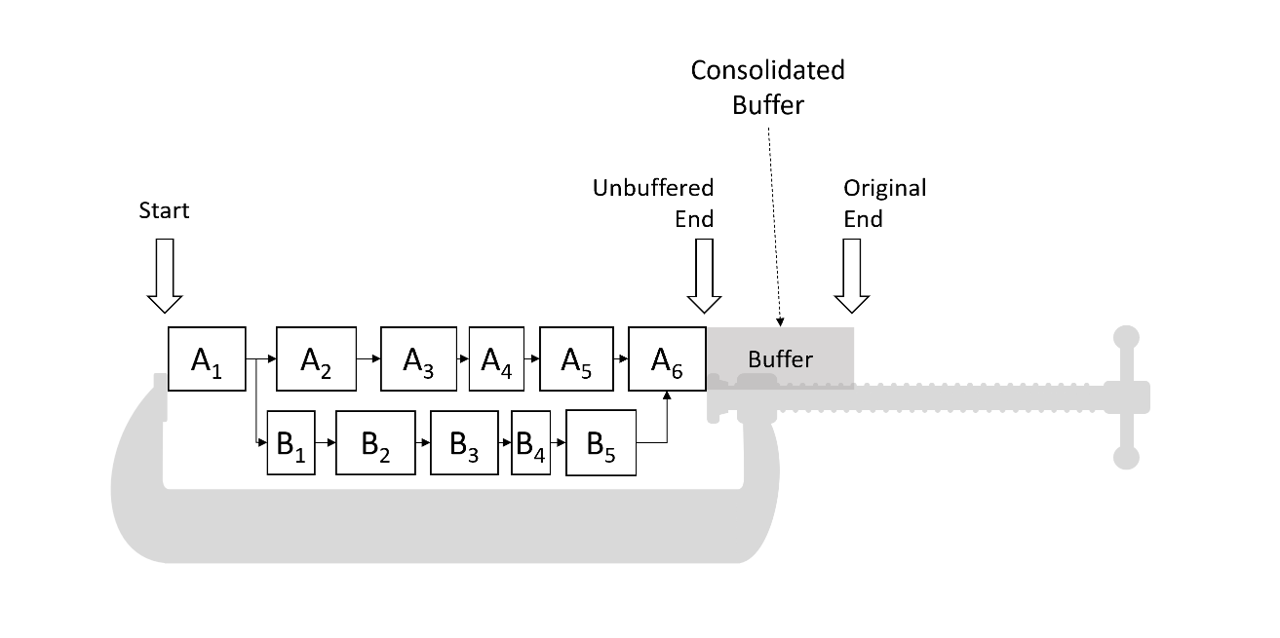
Figure: Consolidated buffer moved to phase end for explicit management.
Distributed buffer characteristics:
- Hard to see and hard to manage.
- Consumed unevenly and often silently.
- Encourages local optimization instead of project optimization.
Consolidated buffer characteristics:
- Explicit and visible to the entire team.
- Measurable through one scoreboard.
- Managed intentionally as a project-level resource.
The critical point: consolidation is not "removing time from the team." It reorganizes where contingency lives so the project can be managed coherently.
The Two Behavioral Effects It Solves
Buffer gets wasted in general because teams naturally place small protective margins into individual tasks, often without explicitly naming that margin as buffer. This is normal expert behavior. The problem emerges when those local margins are spread across long chains of dependent work. At project scale, distributed buffer is consumed by behavior before it can protect delivery.
In practical terms, this creates two recurring effects. First, people delay starts because local task margin feels available. Second, once work begins, effort expands to fill the allotted duration. Together, these patterns burn schedule protection invisibly and early, long before the team believes it is in trouble.
Student Syndrome
When people perceive large local margin on a task, they are more likely to delay starting. Valuable time is consumed before execution even begins.
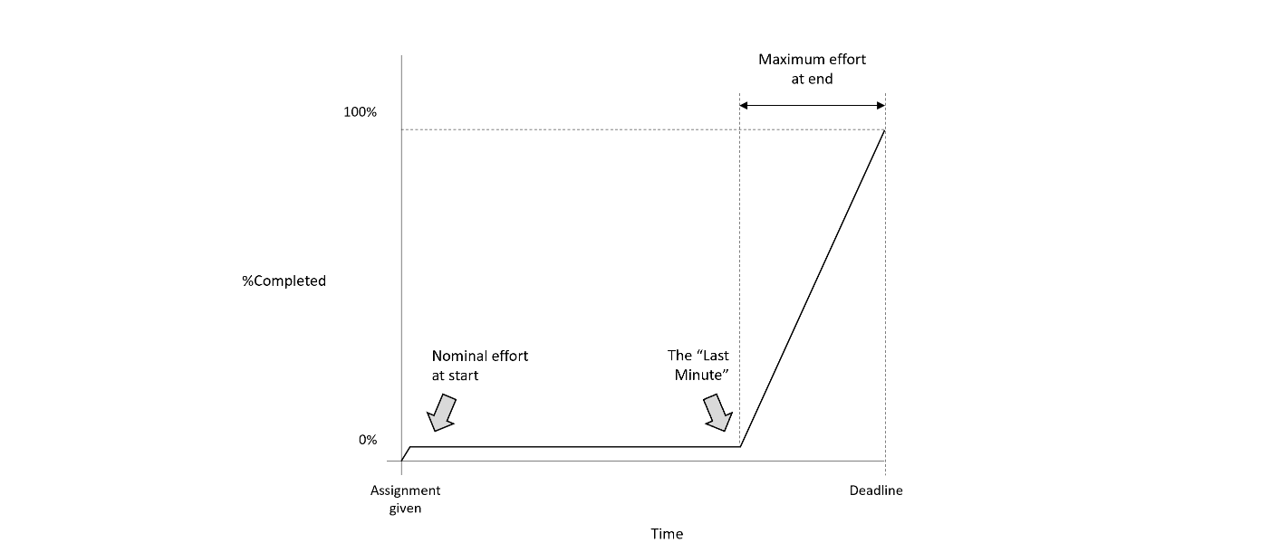
Figure: Student Syndrome - delayed start consumes local buffer before meaningful execution begins.
Parkinson's Law
When generous duration is assigned, work tends to expand into the allotted time. Tasks that could close earlier often do not.
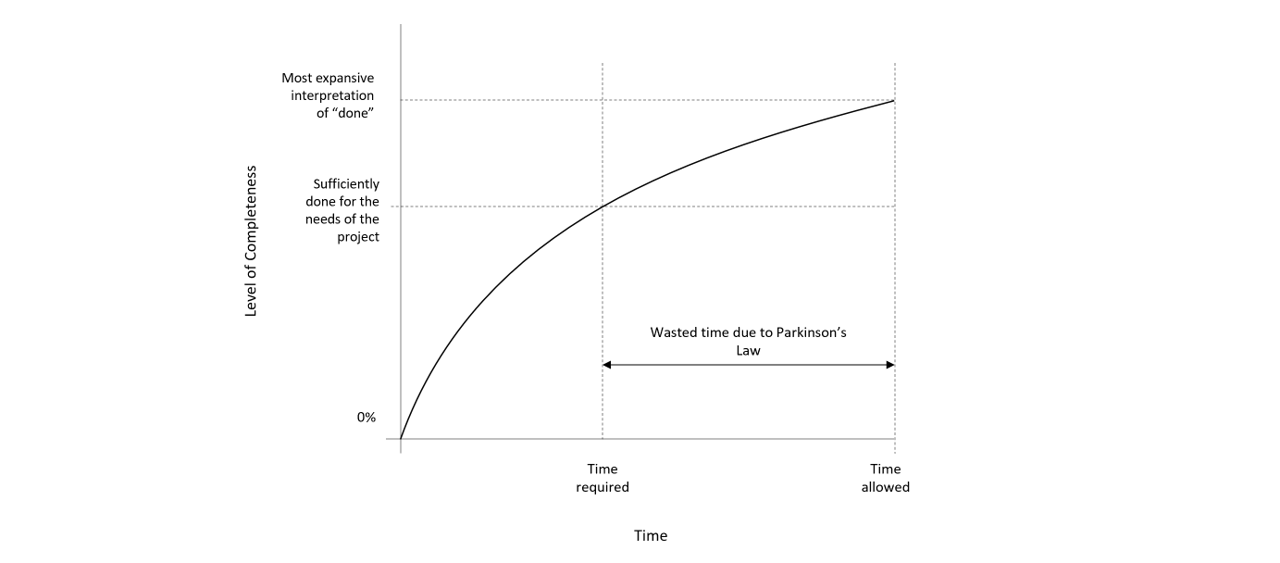
Figure: Parkinson's Law - work expands to fill allotted time, consuming schedule protection.
Consolidated buffer mitigates both:
- It reduces perceived task-level slack, improving start behavior.
- It encourages earlier task closure when deliverables are actually ready.
Practical Buffer Sizing Philosophy
VPM Works favors practical, trust-preserving sizing over rigid formulas.
Guiding principles:
- Begin with team-owned estimates, then compress intentionally.
- Keep commitments believable enough that teams maintain ownership under stress.
- Never commit externally to the buffered schedule. All stakeholder communication should anchor to committed dates.
- Remind the team they will get to use that buffer, and teams almost always do. Buffer is not taken away; it is placed where the team can pull from it when it is most needed.
Many teams operate effectively near 20-30% aggregate project buffer, adjusting by risk profile. The point is not mathematical elegance. The point is operational reliability.
Buffered Planning Workflow
A robust buffered planning cycle typically follows this sequence:
- Build the integrated cross-functional swim-lane plan.
- Identify likely critical and near-critical chains.
- Compress task durations to realistic best-case operating values.
- Move removed contingency to explicit project buffer at phase end.
- Confirm immovable external dates (events, holidays, compliance milestones).
- Define playbook thresholds and escalation expectations.
- Launch with a visible Project Canvas and fever chart.
Fever Chart as a Leading Indicator
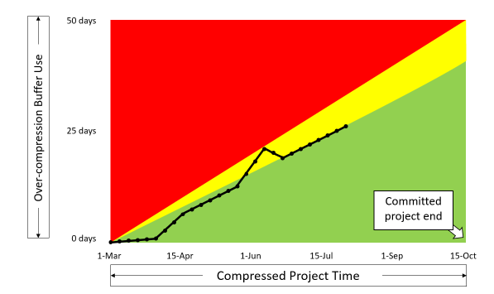
Figure: Fever chart used as a leading indicator of schedule risk in buffered execution.
The fever chart tracks buffer consumed over elapsed time.
- X-axis: elapsed calendar time in the active phase.
- Y-axis: cumulative buffer consumed.
A diagonal reference line represents proportional burn. Points below the line indicate stable control; points above the line indicate increasing risk.
Operational states:
- Green: continue normal execution.
- Yellow: prepare countermeasures before failure occurs.
- Red: Stop-Fix immediately.
The key advantage is timing. Teams react before committed dates are missed.
Project Canvas in Buffered Mode
Buffered execution uses a single-page project canvas combining:
- Fever chart
- Date strip
- Project flow view
- Done line
- Explicit buffer region
- Milestones and context header
This one-page constraint is deliberate. Teams should not need scrolling and hunting to understand current schedule health.
The Buffered Daily Drill
The buffered stand-up is a six-step management kata:
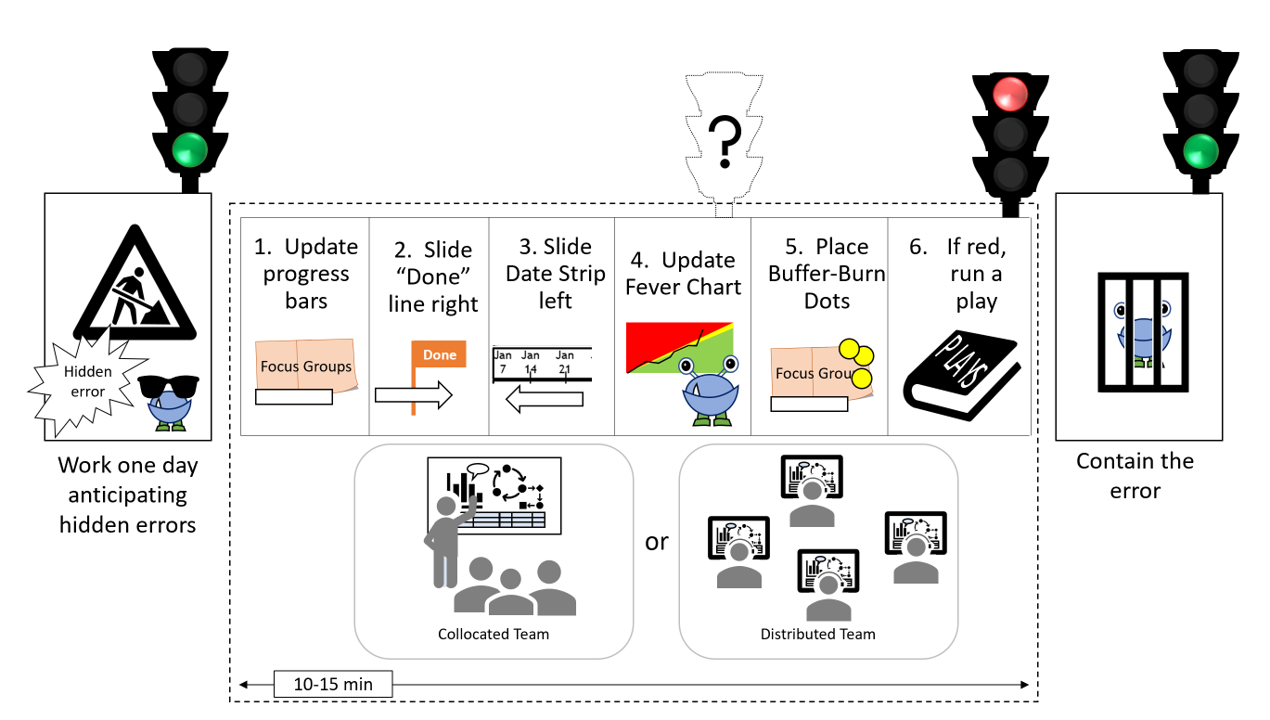
Figure: Six-step daily management drill for buffered execution.
- Update progress bars.
- Move Done line.
- Shift date strip if Done trails Today.
- Plot fever point.
- Place delay dots on responsible task paths.
- If red, run a play.
This drill creates a "visual agreement" check:
- Date-strip shift
- Fever-chart burn
- Delay-dot count
These three views should agree every cycle. If they do not, the team is usually reporting after the fact instead of managing live.
Stop-Fix in Buffered Methodology
Buffered execution is not passive tolerance. It is earlier intervention.
When buffer is in the red, teams do not continue normal work and hope for recovery. They run Stop-Fix and execute plays to restore schedule health while options still exist.
Typical play classes:
- Restructure work.
- Increase effective capacity.
- Reduce effort.
- Recommit delivery conditions when recovery is no longer credible under current constraints.
Calendar Effects and Hard-Date Handling
Buffered schedules can appear counterintuitive early in long phases. Work that ultimately occurs near year-end may visually appear earlier when viewed months in advance. As execution unfolds, controlled buffer pull realigns the schedule trajectory.
Hard dates must be treated explicitly:
- Trade shows
- Regulatory submissions
- Customer events
- Holiday shutdown periods
These are not ordinary internal targets and should be modeled as boundary conditions.
Common Fever-Chart Patterns
Pattern literacy improves management speed and quality because it turns the fever chart from a status artifact into an operational early-warning system. Teams and leaders who can recognize recurring patterns quickly can distinguish normal variability from emerging structural risk, choose stronger interventions earlier, and avoid wasting time debating whether a signal is "real." This is one of the strongest practical advantages of buffered execution: the organization builds shared pattern recognition over time, and that accumulated recognition materially improves forecast quality, decision speed, and recovery effectiveness.
Teams repeatedly observe several patterns:
- Tough project: repeated pushes toward red with rapid recoveries.
- Easy project: consistently far from red, sometimes indicating under-challenge.
- More-is-better pattern: team accepts red too long and normalizes alarm state.
- Ineffective management pattern: late discovery and sudden deep red moves.
Portfolio Snapshot (Helicopter View)
The Portfolio Snapshot is one of the highest-leverage practices in buffered project management. Single-project fever charts provide ground truth for one team; the snapshot aggregates that logic across the full active portfolio so leaders can see risk concentration in seconds. Instead of spending hours collecting fragmented status narratives, leadership can immediately identify where intervention is needed, where teams are in healthy control, and where alarm conditions are becoming systemic.
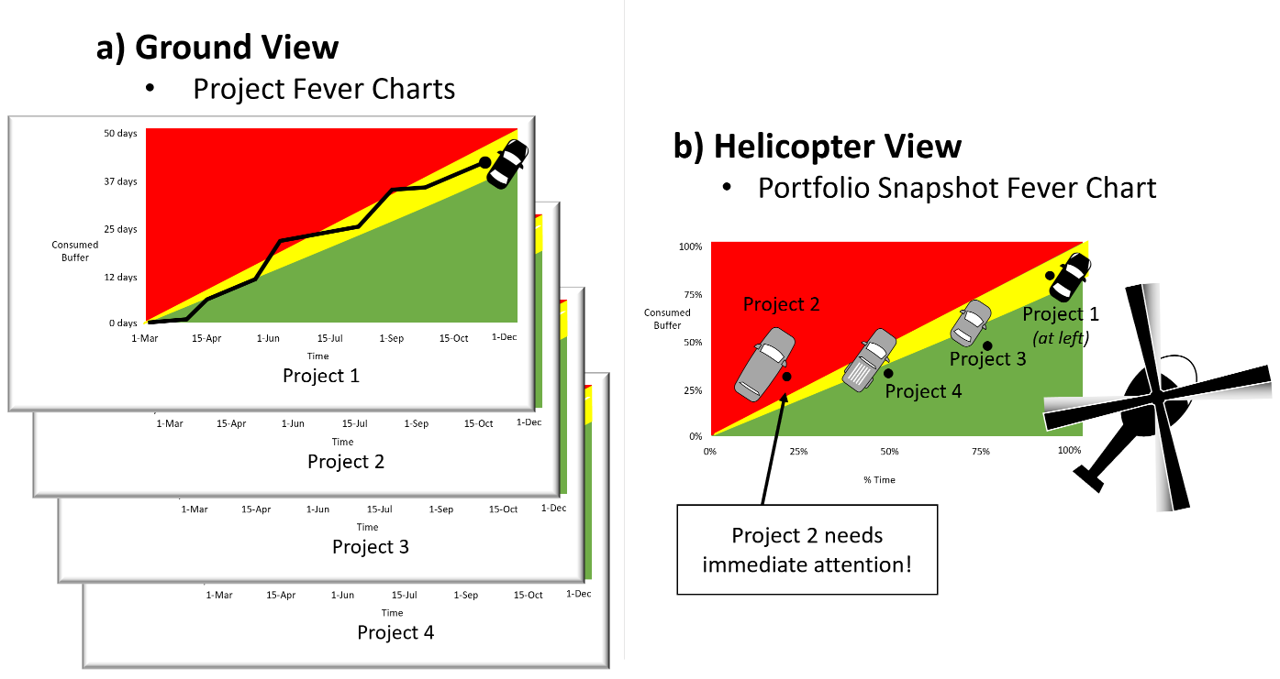
Figure: Portfolio snapshot view of fever-chart status across multiple projects.
This changes leadership behavior in a practical way: response shifts from retrospective explanation to near-real-time triage. Over time, teams also adapt to the signal. As snapshot discipline improves, false alarms decline, true risk detection improves, and project teams increasingly resolve emerging red conditions before they become portfolio-level disruptions.
Used well, this creates two benefits:
- Faster attention to true schedule threats.
- Less time spent on low-value status chasing.
Adoption Strategy
Buffered methodology requires behavior change, not only new artifacts. Teams need to change how they interpret schedule health, how quickly they escalate risk, and how consistently they run daily visual drills. Leaders also need to change behavior by responding rapidly to red conditions, reinforcing transparency, and avoiding retrospective blame cycles. Without these behavior shifts, the canvas, fever chart, and templates become reporting tools instead of execution tools.
Recommended rollout:
- Pilot on one or two meaningful projects.
- Train stand-up leaders in six-step discipline.
- Standardize canvas conventions before automating anything.
- Review red events quickly and visibly.
- Expand after teams demonstrate repeatable control.
Choosing Buffered vs Unbuffered
For practical mode-selection guidance, see Choose the Right Execution Mode.
Relationship to Compression
Buffer methodology and compression are complementary:
This distinction is easy to confuse and important to get right. Compression is how the team determines what should be committed and by when. Buffer is not a substitute for compression, and it does not move the commitment date. The committed date comes from disciplined compression work; buffer is then set aside so the team can absorb normal execution variability without breaking that commitment. A useful analogy is a watch: compression is setting the watch to the correct time; buffer is setting it five minutes ahead so you are less likely to be late. One determines the real target. The other improves reliability in getting there.
- Buffer methodology governs how schedule risk is measured and managed during execution.
- Compression techniques provide tactical options for restoring performance when alarms occur.
For tactical recovery methods, see Compression Techniques.
See Also
Related: Risk and Buffers — why the buffer, not the risk register, is VPM's primary risk instrument.